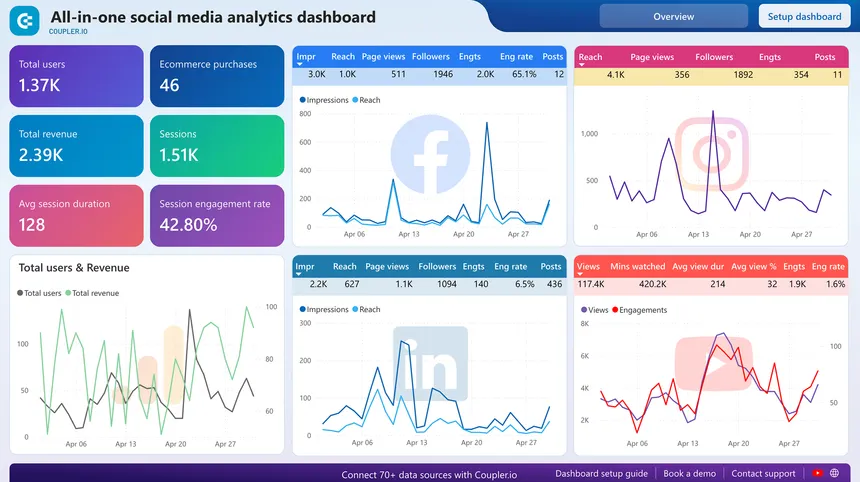
A comprehensive data analytics dashboard providing business intelligence insights through interactive visualizations, real-time data updates, and automated reporting capabilities.
Key Features:
- Interactive charts and graphs with D3.js
- Real-time data updates
- Customizable dashboard layouts
- Automated report generation
- Data export functionality
- User role-based access control
- Mobile-responsive design
- Integration with multiple data sources
Technologies Used:
- Backend: Python, FastAPI, PostgreSQL, Redis
- Frontend: React, D3.js, Chart.js
- Data Processing: Pandas, NumPy
- Deployment: Docker, Kubernetes
- Monitoring: Grafana, Prometheus

